Pages

Monday 30 December 2013

Nam Cheong - Here it comes! WoooT

As previously posted, here and here
Nam Cheong has break out. Here it comes!


Cheers and congrats to all vested! Enjoy the coming New Year Holidays!

Friday 27 December 2013

Happy Holidays - Santa Claus Rally, HO HO HO.

Christmas might be over for some, but for the stock market it is still enjoying the presents that Santa Claus Rally is giving.

The Santa Claus rally is a period between christmas and the new year where stock markets rally to a high point. There are many different explanation for this phenomenon, some say is due to people investing their christmas bonuses while others claims that shortist are on holidays. For this year, some claim to be the effect of the Fed's cut in stimulus program that demonstrate strong recovery in the economy. For me, it does not really matter as long as the market is moving in the right direction.

As seen from yesterday's market result, the top 20 counter are all GREENS, which shows that the rally is indeed beginning. It is a good time to buy(almost any stocks). But the question is how long will it last? and what to do when it ends? The obvious answer is to take profit and wait for the next entry point.

So the more important question is when to take profit? For me, there are 2 answer. 1st is when the stock has reached your target price (pretty obvious). 2nd is when the stock seems to have peaked at the current price. For analysing when the peak is reach, I normally look at 2 indictors, the stochastic cross over at the top and the closing major support price. (i cant find a good picture right now, will attach it once I get home)

Meanwhile, enjoy the rally and have a wonderful holiday!

Side note: if you still considering what to enter, you might want to have a look @ krisenergy and mirach energy. Most stock have already begin their rally but these energy stocks seems quiet. they might be having some delay effect.

Thursday 19 December 2013

Rex - On target. More to Come?

For those that followed my post http://singaporestocktechnicalanalysis.blogspot.sg/2013/12/fifo-fast-in-fast-out-rex.html

you should have gained some nice profit (>5%). So is it time to hold or sell? for risk averse, you may like to take some profit. Whereas if you are more of a risk taker, look out for a break at $0.67 and the next TP should be near $0.75.


Cheers. Remember to share my post if you have profited. :)

Tuesday 17 December 2013

Outlook of Straits Time Index - STI

Lately the STI seems to be losing its strength, moving from a 3400++ high in mid-year to 2900++ in recent months, and now it is hovering around 3050. So where exactly is its heading? Is the uptrend still intact? Or is it moving into a reverse, downtrend?

From the charts, we can clearing see that the recent sell-off is probably just a correct, before the uptrend resumes.


As seem from the weekly charts, the uptrend channel is still firmly intact, with the current index hitting the uptrend support line.


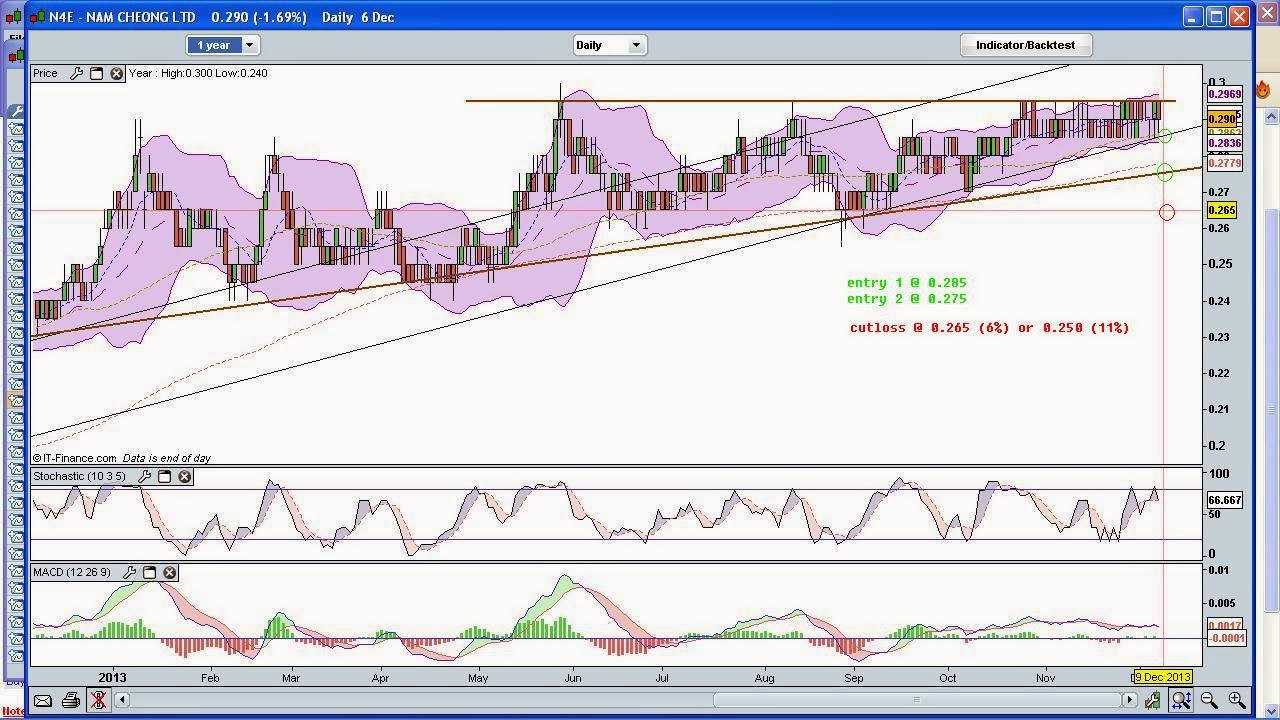
Similarly, from the daily charts, you can see the 2 uptrend support line (thinner brown line) recent low have moved slightly below the support line, however it has then since rebounded backup and seems to be moving up towards the support line. Also if you enlarge the chart, you would be able to see the green circles,1) for MACD, the lows are getting higher, which indicated declining strength of the bear. 2)Stochastic crossover of signal follow by the 20% level. 3)Price action of the chart bouncing of the uptrend support line. These are all indication of an up-turn.

From both charts, we can see that the index is still moving in an uptrend, and the current level actually provides a very good entry opportunity since it is at the low of current support line. Coupled with a tight cut loss (at around 2900 would work for me) provide a good risk to reward ratio.

Please share my blog fit you have profited from it. Cheers!


Monday 16 December 2013

Good time to take profit - EMS

if you were following my post, you would have notice this on EMS energy stock. I have emphasized 2 good entry points. now would be a good time to take some profit, as it hits the $0.70 resistance I mentioned.

link to previous posting http://singaporestocktechnicalanalysis.blogspot.sg/2013/11/opportunity-lost-maybe-maybe-not-ems.html


chart as of today. If you entered at my suggested price, you would have gain a minimum of 7% profit. remember to share my blog if you have profited. Cheers!

FIFO, Fast IN Fast OUT - REX

opportunity for fast money.


charts looks good with stochastic cross over soon. support level at $0.6 seems to be holding up pretty well.
Good opportunity to get in for some quick profits. Target price at blue resistance line, around $0.66, cut loss to set a just 2-3 bids below support level. Don't forget to share my blog if you profit from it. Cheers


Side track: another stock to keep an eye on. reversal candle on support line. ;)


Wednesday 11 December 2013

Up or down?, you decide - Noble group

Chart showing past 1 year


As shown from the chart, it seem like noble is on an uptrend since early September. The trend continued in a narrow channel(brown bold parallel line) till late Nov, at the price of around $1.12. There was even an golden cross of 50ma vs 150ma. However, since then price came crushing down to around $1.03, which then was supported by the 50ma. So why did it hit $1.12 than came down?

Lets take a closer analysis by looking at the 2 year chart.

Chart Showing past 2 years (on weekly basis, to present more clarity)

Add caption


As you can see, the price action has been moving in a major down trend channel (brown parallel line) for the past 2 years. And the recent high of $1.12 is actually the resistance of the upper trend line. Hence, price will have to break the resistance line to truly indicate an reversal. This would be wiser not to take any position at the current moment and wait for clearer signal. A break below the 50ma support will means the down trend is likely to continue. While a clear break above the down trend line(upper) would signal a trend reversal. But the wiser would definitely not bet against the trend.

For now, as the topic goes... :)

Monday 9 December 2013

Nam Cheong - signs still positive

Roughly about 3 weeks ago, I posted a chart analysis for Nam Cheong with ending ascending triangle breakout. Although it seems to be still consolidating, signs are showing that breakout will come out sooner than later.


It has been trading at a range of 0.285 - 0.295 for nearly a month now, also with signification increase in volume. On the charts, I have placed emphasize on good entry position and a target cut loss price (in case things suddenly go south, which is highly unlikely). If stochastic continues to hit its low at 0.285, the trend will move the price in its direction. UP!

Friday 6 December 2013

STI Index to re-test 3000 support


A sharp drop of 1.15% in ST index today, breaking support of the minor uptrend line. A further support break of the major support trend line at 3100 (red circle 1) could see the index goes back down to 3000 (red circle 2) and then 2700 (red circle 3) before we could see the next bounce. Meanwhile, it looks wiser to have cash on hand and entry on support bounce.