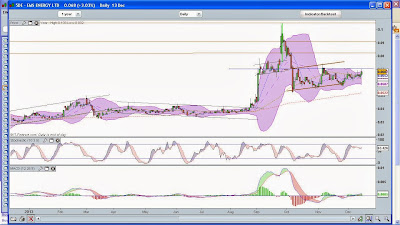
From the charts, we can clearing see that the recent sell-off is probably just a correct, before the uptrend resumes.
As seem from the weekly charts, the uptrend channel is still firmly intact, with the current index hitting the uptrend support line.
Similarly, from the daily charts, you can see the 2 uptrend support line (thinner brown line) recent low have moved slightly below the support line, however it has then since rebounded backup and seems to be moving up towards the support line. Also if you enlarge the chart, you would be able to see the green circles,1) for MACD, the lows are getting higher, which indicated declining strength of the bear. 2)Stochastic crossover of signal follow by the 20% level. 3)Price action of the chart bouncing of the uptrend support line. These are all indication of an up-turn.
From both charts, we can see that the index is still moving in an uptrend, and the current level actually provides a very good entry opportunity since it is at the low of current support line. Coupled with a tight cut loss (at around 2900 would work for me) provide a good risk to reward ratio.
Please share my blog fit you have profited from it. Cheers!


